The following volume-temperature plots were made at different values of constant pressure while the number of moles of gas in each experiment remained the same.Which plot represents measurements at the highest pressure? 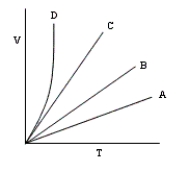
A) B
B) C
C) A
D) They are all at the same pressure.
E) D
Correct Answer:
Verified
Q9: The pressure of a certain gas is
Q10: It is possible to make a barometer
Q11: A particular gas exerts a pressure of
Q12: A particular gas exerts a pressure of
Q13: A particular gas exerts a pressure of
Q15: A sample of methane,CH4,occupies a volume of
Q16: The pressure of a certain gas is
Q17: A particular gas exerts a pressure of
Q18: A particular gas exerts a pressure of
Q19: When the valve between the 2.00-L bulb,in
Unlock this Answer For Free Now!
View this answer and more for free by performing one of the following actions

Scan the QR code to install the App and get 2 free unlocks

Unlock quizzes for free by uploading documents