The following plot shows a titration curve for the titration of 1.00 L of 1.00 M diprotic acid H2A+ with NaOH.Which point a-d represents the isoelectric point? 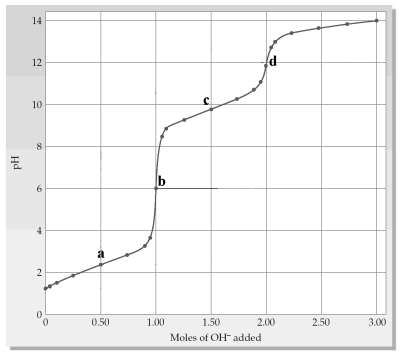
A) point a
B) point b
C) point c
D) point d
Correct Answer:
Verified
Q101: The following pictures represent solutions of AgCl,which
Q108: The following pictures represent solutions of CaCO3,which
Q109: The following pictures represent solutions of CaCO3,which
Q110: The following plot shows a titration curve
Q112: The following pictures represent solutions of AgCl,which
Q113: The following pictures represent solutions of CaCO3,which
Q115: What is the pH at the first
Q118: The following pictures represent solutions of CuS,which
Q119: The following pictures represent solutions of CuS,which
Q120: The following plot shows a titration curve
Unlock this Answer For Free Now!
View this answer and more for free by performing one of the following actions

Scan the QR code to install the App and get 2 free unlocks

Unlock quizzes for free by uploading documents