Refer to the following graphs to answer the following questions.
A. 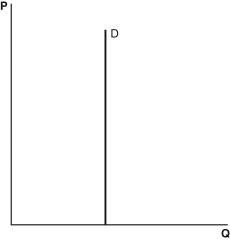 B.
B. 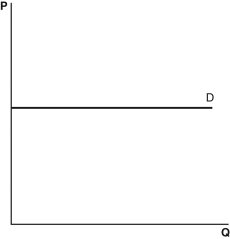 C.
C. 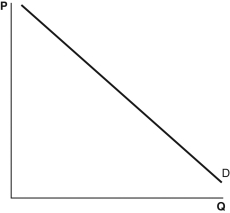 D.
D. 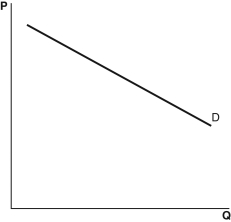 E.
E. 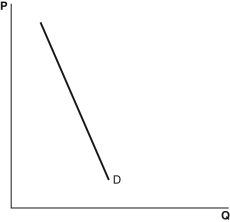
-Which of these graphs most likely depicts a price elasticity of demand of -0.2?
A) Graph A
B) Graph B
C) Graph C
D) Graph D
E) Graph E
Correct Answer:
Verified
Q54: Refer to the following graphs to answer
Q55: Refer to the following graphs to answer
Q56: When would oil producers see the largest
Q57: Refer to the following graphs to answer
Q58: Refer to the following graphs to answer
Q60: Lee says that he will always spend
Q61: Firms are indifferent to changing prices when
Q62: How can a firm increase total revenue?
A)
Q63: Refer to the accompanying table.The price elasticity
Q64: When Kelsey decreases her price of lipstick
Unlock this Answer For Free Now!
View this answer and more for free by performing one of the following actions

Scan the QR code to install the App and get 2 free unlocks

Unlock quizzes for free by uploading documents