Essay
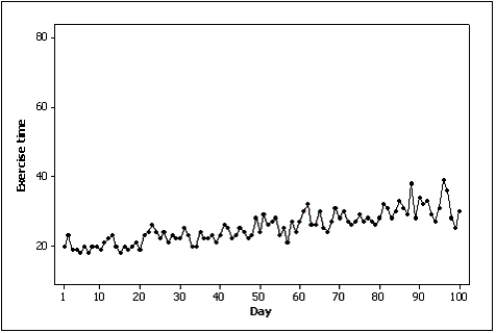
Samantha recorded her amount of exercise time (in minutes)for 100 days.Both of the line charts below were created based on her same data set.Which line chart makes her exercise times look more variable and why? 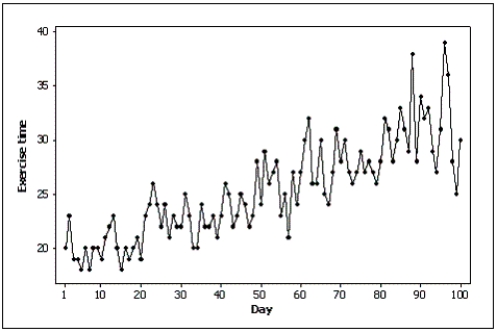
Correct Answer:
Verified
The first line chart looks mor...
View Answer
Unlock this answer now
Get Access to more Verified Answers free of charge
Related Questions
Q146: Home Care Data are collected on
Q147: Briefly explain why the histogram below is
Q148: Credit Hours The College of Business at
Q149: In its 2000 report,a company presented the
Q150: Home Care Data are collected on
Unlock this Answer For Free Now!
View this answer and more for free by performing one of the following actions

Scan the QR code to install the App and get 2 free unlocks

Unlock quizzes for free by uploading documents