The scatter diagram below depicts data with a negative linear relationship. 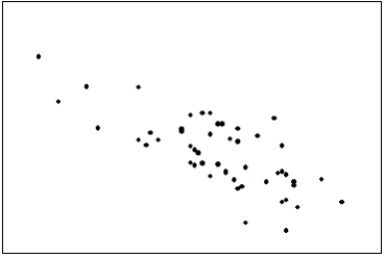
Correct Answer:
Verified
Q7: Correlation implies causation.
Q88: The two most important characteristics revealed by
Q89: The graphical technique used to describe the
Q91: If the data in a scatter diagram
Q92: When two variables are linearly related,and tend
Q94: In applications involving two variables,X and Y,where
Q95: The relationship between two interval variables is
Q96: If we draw a straight line through
Q97: Which of the following describes a positive
Q98: The first scatter diagram below shows a
Unlock this Answer For Free Now!
View this answer and more for free by performing one of the following actions

Scan the QR code to install the App and get 2 free unlocks

Unlock quizzes for free by uploading documents