Which type of relationship is graphed in the following scatterplot? 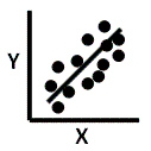
A) no relationship
B) positive curvilinear relationship
C) negative linear relationship
D) positive linear relationship
Correct Answer:
Verified
Q66: If you compute a negative Pearson r
Q67: Refer to the following data set.
Q68: Refer to the following data set.
Q69: Outliers are most likely to produce misleading
Q70: The purpose of a scatterplot is to
A)graph
Q72: Refer to the following data set.
Q73: Researchers were recently surprised to learn that
Q74: In a scatterplot,the X variable should be
Q75: The _ represents the average error across
Q76: The Pearson correlation coefficient (r)provides information about
Unlock this Answer For Free Now!
View this answer and more for free by performing one of the following actions

Scan the QR code to install the App and get 2 free unlocks

Unlock quizzes for free by uploading documents