Multiple Choice
FIGURE 12-6 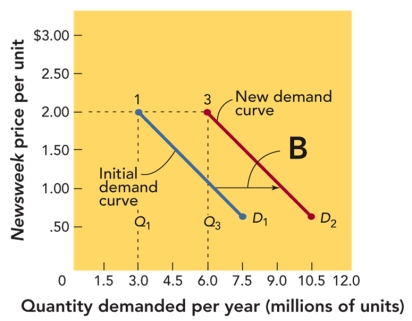
-A shift of the demand curve from D1 to D2 in Figure 12-6 above indicates
A) more units are demanded at a given price.
B) fewer units are demanded at a given price.
C) the price has decreased.
D) the price has increased.
E) There is not enough information given to indicate what happened.
Correct Answer:
Verified
Related Questions
Q148: While consumer tastes and price and availability
Q172: Which of the following statements about the
Q173: Demand factors refer to
A) the number of
Q174: The horizontal axis of a demand curve

