In the figure given below,the competitive supply curve of a commodity is given by S1,the private marginal benefit curve is D1,the marginal social benefit curve is D2,and the MBE curve reflects the marginal external benefits. 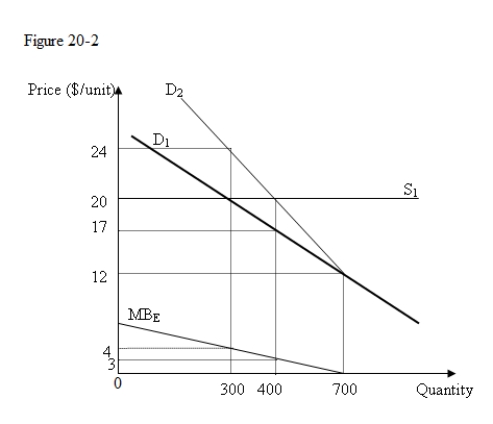
-In Figure 20-2,the efficient output is:
A) 700 units.
B) 400 units.
C) 300 units.
D) 0 units.
Correct Answer:
Verified
Q63: In the figure given below,the competitive supply
Q64: In the figure given below,D1 and S1
Q66: In the figure given below,the competitive supply
Q66: The marginal social cost and marginal private
Q67: In the figure given below,D1 and S1
Q67: Reducing automobile pollution beyond a certain point
Q69: In the figure given below,the competitive supply
Q69: If the production of a certain commodity
Q71: In the figure given below,the competitive supply
Q73: In the figure given below,D1 and S1
Unlock this Answer For Free Now!
View this answer and more for free by performing one of the following actions

Scan the QR code to install the App and get 2 free unlocks

Unlock quizzes for free by uploading documents