The following figure shows the marginal cost curve,average total cost curve,average variable cost curve,and marginal revenue curve for a firm for different levels of output.
Figure 9-3 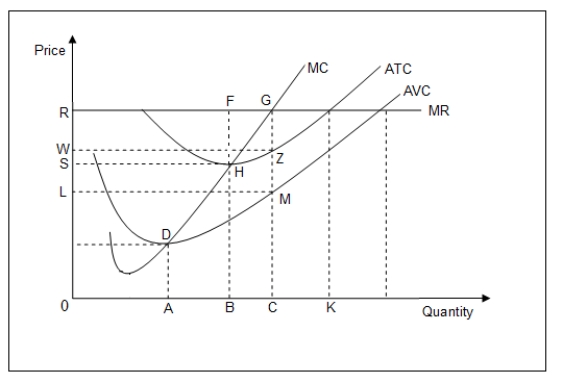
-At the profit-maximizing level of output in Figure 9-3,the profit of the firm is equal to the area given by _____.
A) RLMG
B) RGZW
C) RGCO
D) RGHS
Correct Answer:
Verified
Q25: The perfectly competitive firm maximizes profits by
Q31: The competitive firm maximizes its profit by
Q33: A profit-maximizing firm expands output until marginal
Q34: The following figure shows the marginal cost
Q35: The following figure shows the marginal cost
Q37: The following figure shows the marginal cost
Q40: The following figure shows the marginal cost
Q46: Assume that labor is the variable input
Q48: Abe's Taxi Company operates in a perfectly
Q58: The short-run supply curve for the firm
Unlock this Answer For Free Now!
View this answer and more for free by performing one of the following actions

Scan the QR code to install the App and get 2 free unlocks

Unlock quizzes for free by uploading documents