The following figure shows the total cost and total revenue for a firm when it prices its products at $8 and $10.
Figure 9-1 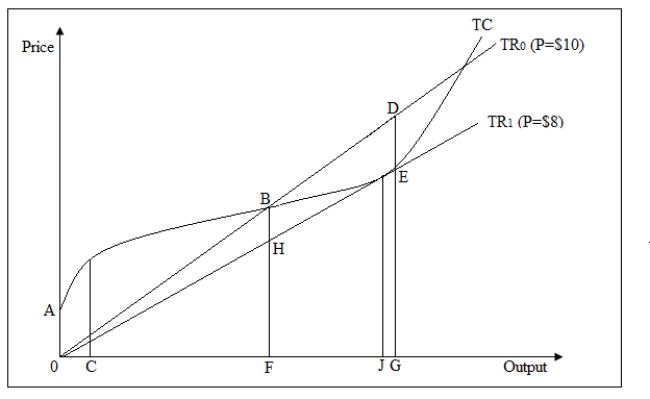
-Refer to Figure 9-1.When the firm is producing the profit-maximizing level of output at a price of $10:
A) total fixed costs are OA.
B) economic profits equal BH.
C) average cost equals DG divided by OG.
D) total cost is minimized at B.
Correct Answer:
Verified
Q22: ref SHAPE \* MERGEFORMAT
The following figure shows
Q23: ref SHAPE \* MERGEFORMAT
The following figure shows
Q23: A competitive firm maximizes profit at the
Q24: The following figure shows the marginal cost
Q25: The following figure shows the total cost
Q26: Profits are maximized at the output level
Q28: The following figure shows the marginal cost
Q29: ref SHAPE \* MERGEFORMAT
The following figure shows
Q30: The following figure shows the marginal cost
Q32: Figure 9-4 shows the marginal cost curve,average
Unlock this Answer For Free Now!
View this answer and more for free by performing one of the following actions

Scan the QR code to install the App and get 2 free unlocks

Unlock quizzes for free by uploading documents