Figure 7-2 shows the total product curve for different levels of a variable input,labor.
Figure 7-2 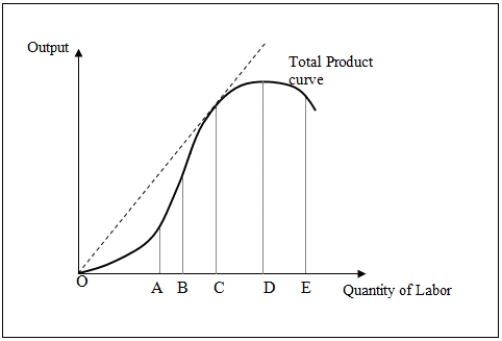
-Between points O and C in Figure 7-2:
A) the marginal product of labor is falling.
B) the average product of labor is rising.
C) total product rises and then falls.
D) marginal product reaches its minimum.
Correct Answer:
Verified
Q30: Which of the following statements is true
Q33: Figure 7-1 shows the total product curve
Q34: Figure 7-2 shows the total product curve
Q36: Figure 7-2 shows the total product curve
Q38: The slope of a ray from the
Q39: The slope of the total product curve
Q39: Figure 7-1 shows the total product curve
Q40: Figure 7-2 shows the total product curve
Q42: Figure 7-2 shows the total product curve
Q54: The law of diminishing marginal returns _.
A)is
Unlock this Answer For Free Now!
View this answer and more for free by performing one of the following actions

Scan the QR code to install the App and get 2 free unlocks

Unlock quizzes for free by uploading documents