In the figure given below,the curve TT shows how the allocation of a resource affects the well-being of two individuals,Hank and Monica. 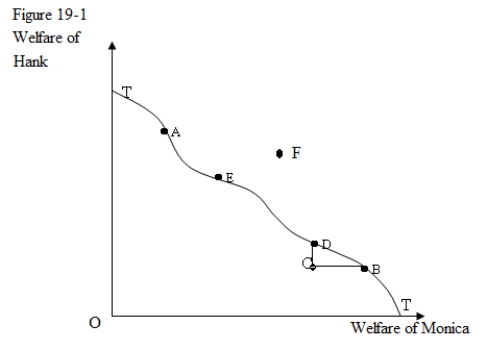
-In Figure 19-1,a movement from A to B would represent:
A) a movement from an efficient allocation of resources to an inefficient one.
B) an improvement of Monica's welfare.
C) a movement from an efficient to an inefficient resource allocation.
D) an improvement in Hank's well-being.
Correct Answer:
Verified
Q1: A Pareto optimal allocation of resources implies
Q2: In which of the following situations would
Q8: General equilibrium analysis is more appropriate than
Q9: Which of the following can be considered
Q10: An efficient distribution of a certain quantity
Q14: A per-unit tax imposed on a product
Q17: An allocation of resources is inefficient if,through
Q18: A change in equilibrium in one market
Q19: In the figure given below,the curve TT
Q19: General equilibrium analysis is the study of:
A)how
Unlock this Answer For Free Now!
View this answer and more for free by performing one of the following actions

Scan the QR code to install the App and get 2 free unlocks

Unlock quizzes for free by uploading documents