Figure 11-3b 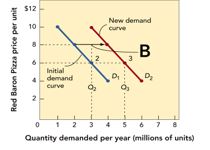
-Figure 11-3b shows that when the quantity demanded for Red Baron frozen cheese pizzas moves from 2 to 3 million units from the demand curve D1 to the demand curve D2,the profit
A) impacts cannot be determined. Figure 11-3b does not indicate what happens to profit when the quantity demanded changes.
B) increases from $2 to $3 per unit.
C) stays the same per unit.
D) increases from $6 to $8 per unit.
E) decreases from $8 to $6 per unit.
Correct Answer:
Verified
Q143: Elastic demand exists when
A) a small percentage
Q145: Inelastic demand exists when
A) a small percentage
Q150: Which of the following illustrates a shift
Q158: The percentage change in quantity demanded relative
Q166: There are a lot of skateboards on
Q189: Mrs.Renfro's,Inc.,sells 25 different relishes in 45 different
Q190: Figure 11-3a Q193: Figure 11-3b Q194: The manufacturer of a new kind of Q195: Figure 11-3a Unlock this Answer For Free Now! View this answer and more for free by performing one of the following actions Scan the QR code to install the App and get 2 free unlocks Unlock quizzes for free by uploading documents![]()
![]()
![]()

