refer to the following diagram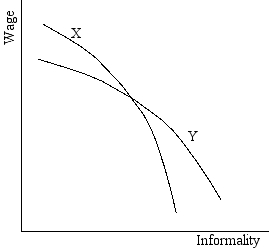
-Which one of the following best explains the differences in the isoprofit curves of the two firms?
A) X has lower profits than Y because X is paying higher wages
B) X has higher profits than Y because X's high wages attract workers who are less relaxed and thereby less likely to shirk on the job
C) X pays a higher cost than Y for providing additional informality
D) Y pays a higher cost than X for providing additional informality
Correct Answer:
Verified
Q30: "The high psychic costs of leaving friends
Q31: An example of a sociological immobility is:
A)ties
Q32: refer to the following diagram Q33: Fringe benefit packages differ substantially from one Q34: refer to the following diagram Q36: refer to the following diagrams. Q37: Imperfect and costly labor market information will Q38: refer to the following diagram Q39: Suppose a firm decides to raise pay Q40: The concept of noncompeting groups suggests that Unlock this Answer For Free Now! View this answer and more for free by performing one of the following actions Scan the QR code to install the App and get 2 free unlocks Unlock quizzes for free by uploading documents![]()
![]()
![]()
![]()

