The Following Questions Refer to the graph below. 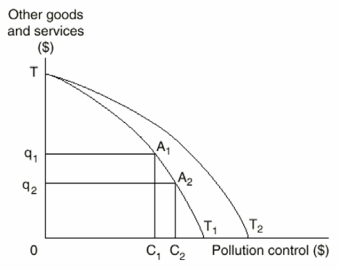
-Which of the following could explain a shift in the production possibilities curve from TT1 to TT2?
A) Over-utilization of pollution control activities
B) Better techniques of pollution control
C) Higher prices for other goods and services
D) Increased benefits from pollution control
E) Better technology for producing other goods and services
Correct Answer:
Verified
Q32: Another term for implicit cost is
A)Out-of-pocket costs
B)Explicit
Q33: Which of the following is a factor
Q34: Payment by a firm to hire a
Q35: The Following Questions Refer to the graph
Q36: The Following Questions Refer to the graph
Q38: The Following Questions Refer to the graph
Q39: The Following Questions Refer to the graph
Q40: The optimal level of pollution control occurs
Q41: The Following Questions Refer to the graph
Q42: The Following Questions Refer to the graph
Unlock this Answer For Free Now!
View this answer and more for free by performing one of the following actions

Scan the QR code to install the App and get 2 free unlocks

Unlock quizzes for free by uploading documents