Consider the graphs that follow (the horizontal axis represents activity; the vertical axis represents total dollars). 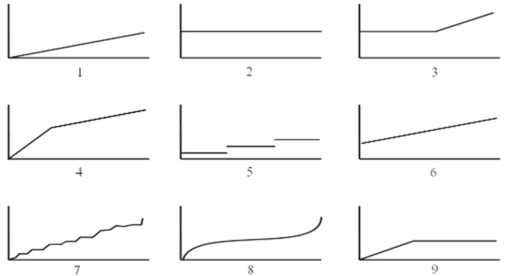 Required:
For items A-I that follow, choose the graph that best represents the cost behaviour pattern described. Note: Graphs can be used more than once.
A. Straight-line depreciation on machinery.
B. The cost of chartering a private airplane. The cost is $800 per hour for the first 6 hours of a flight; it then drops to $600 per hour.
C. The wages of table service personnel in a restaurant. The employees are part-time workers who can be called upon for as little as 4 hours at a time.
D. Weekly wages of store clerks who work 40 hours each week. One clerk is hired for every 125 sales made during the month.
E. The cost of tires used in the production of trucks.
Up to 20,000 kilowatt hours (KWH): $4,000
Above 20,000 kilowatt hours: $4,000 + $0.02 per KWH
Correct Answer:
Verified
View Answer
Unlock this answer now
Get Access to more Verified Answers free of charge
Q45: George Henry Corporation has a machining
Q46: Sugarsweet Confections Inc. produces one of the
Q47: Yang Manufacturing, which uses the high-low
Q48: Dollah Corporation is studying its marketing
Q49: The following data were taken from
Q51: Walnut Corporation operates a small medical lab
Q52: Consider the six costs that follow.
1. Advertising
Q54: Which of the following is not an
Q55: A staff assistant at Cornwall Corporation recently
Q81: Compare and contrast the following types of
Unlock this Answer For Free Now!
View this answer and more for free by performing one of the following actions

Scan the QR code to install the App and get 2 free unlocks

Unlock quizzes for free by uploading documents