The following graph depicts demand. 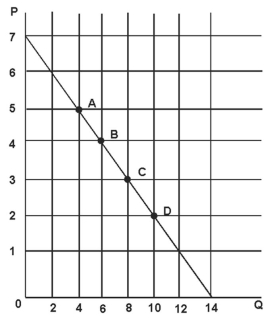
Refer to the figure above.The price elasticity of demand at point D is:
A) 5/2.
B) 1/2.
C) 2/5.
D) 2.
Correct Answer:
Verified
Q28: If the consumers can easily switch to
Q30: If the percentage change in the price
Q35: Suppose that the demand for electricity has
Q42: If the elasticity of demand for the
Q44: The following graph depicts demand. 
Q47: The following graph depicts demand.
Q48: The following graph depicts demand.
Q49: Suppose two demand curves have a point
Q53: Suppose you have one hour to catch
Q56: Price elasticity of demand for transportation generally
Unlock this Answer For Free Now!
View this answer and more for free by performing one of the following actions

Scan the QR code to install the App and get 2 free unlocks

Unlock quizzes for free by uploading documents