This graph shows one consumer's demand for ice cream at the student union: 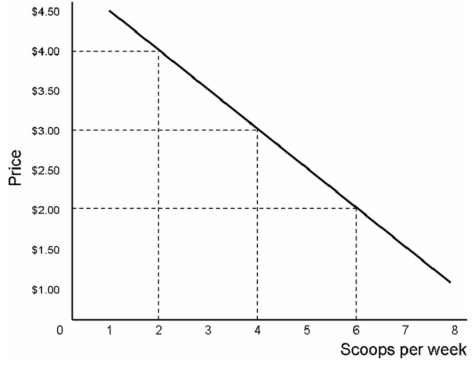
During the semester,the student union charges $3.00 per scoop.If every student who buys ice cream has the demand curve shown,when there are 1,000 students _____ scoops are sold per week.
A) 400
B) 1,000
C) 2,000
D) 4,000
Correct Answer:
Verified
Q40: When the price of a good falls,the
Q63: Suppose you want to equalize your marginal
Q80: Pat applies the rational spending rule and
Q82: This graph shows one consumer's demand for
Q84: This graph shows one consumer's demand for
Q86: If the marginal utility per dollar is
Q87: This graph shows one consumer's demand for
Q88: The fact that the average price of
Q88: This table shows demand for shoes
Q97: Suppose you are a government analyst,and you
Unlock this Answer For Free Now!
View this answer and more for free by performing one of the following actions

Scan the QR code to install the App and get 2 free unlocks

Unlock quizzes for free by uploading documents