The figure shows the graph of vx versus time for an object moving along the x-axis.Solve graphically for the average acceleration between t = 5.0 s and t = 9.0 s. 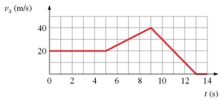
A) 4.0 m/s2
B) 5.0 m/s2
C) 0.5 m/s2
D) 0.4 m/s2
Correct Answer:
Verified
Q5: Two masses are being pulled up a
Q6: Two masses are being pulled up a
Q7: Two masses are connected by a string
Q8: Two masses are being pulled up a
Q9: Two masses are connected by a string
Q11: Two masses are being pulled up a
Q12: A ball is thrown upward at a
Q13: Two masses are connected by a string
Q14: A rock is thrown straight up and
Q15: Two masses are connected by a string
Unlock this Answer For Free Now!
View this answer and more for free by performing one of the following actions

Scan the QR code to install the App and get 2 free unlocks

Unlock quizzes for free by uploading documents