Which of the following two statements is true of the graph shown below? Statement 1: The graph leads to a supply of labor curve that is positively sloped throughout.
Statement 2: The opportunity cost of leisure is lower at point A than at pointD. 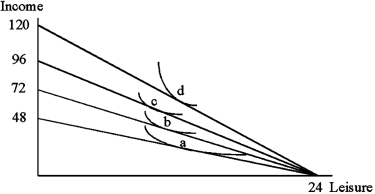
A) Statement 1
B) Statement 2
C) Both statements are true
D) None of the statements is true
Correct Answer:
Verified
Q18: The substitution effect of an increase in
Q19: Say a worker sees work and leisure
Q20: For the monopolist,
A)decreasing returns to scale cause
Q21: Proponents of the minimum wage implicitly assume
Q22: If an additional worker costs you $15
Q24: The competitive labor market model suggests that
Q25: Which of the following would cause the
Q26: Which of the equilibrium points on the
Q27: If minimum wages in a monopsony labor
Q28: Pay rates within a firm seem to
Unlock this Answer For Free Now!
View this answer and more for free by performing one of the following actions

Scan the QR code to install the App and get 2 free unlocks

Unlock quizzes for free by uploading documents