The graph below illustrates which deceptive technique? 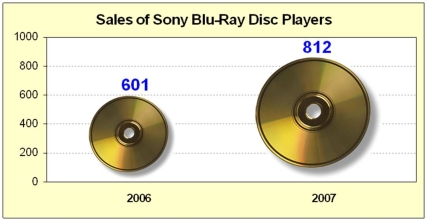
A) Poor Y axis scale
B) Area trick
C) Unclear grid lines
D) Dramatic title
Correct Answer:
Verified
Q57: Which data would be suitable for a
Q58: Which is a reason for using a
Q59: Which is not a tip for effective
Q60: We would use a pivot table to:
A)cross-tabulate
Q61: The distribution pictured below is: 
Q63: Which is not a characteristic of a
Q64: Which is not a characteristic of using
Q65: The width of a class in a
Q66: Which of these deficiencies would be considered
Q67: An open-ended bin (e.g., "50 and over")
Unlock this Answer For Free Now!
View this answer and more for free by performing one of the following actions

Scan the QR code to install the App and get 2 free unlocks

Unlock quizzes for free by uploading documents