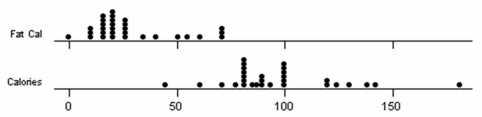
A team of introductory statistics students went to a grocery store and recorded the total calories and fat calories for various kinds of soup. They produced a table of statistics and two dot plots. Write a succinct summary of the center, variability, and shape for each data set. Note: TrimMean is the 5 percent trimmed mean (removing the smallest 5 percent and the largest 5 percent of the values, rounded to the nearest integer).
Correct Answer:
Verified
View Answer
Unlock this answer now
Get Access to more Verified Answers free of charge
Q137: Which of the following statements is likely
Q138: If Excel's sample kurtosis coefficient is negative,
Q139: Find the coefficient of variation of these
Q140: Twelve students were asked how many credit
Q141: Below are shown a dot plot
Q143: Here are advertised prices of 21 used
Q144: Bob's sample of freshman GPAs showed a
Q145: Briefly describe this sample of departure delays
Q146: Six graduates from Fulsome University's Master's of
Q147: Briefly describe these data. Sketch its
Unlock this Answer For Free Now!
View this answer and more for free by performing one of the following actions

Scan the QR code to install the App and get 2 free unlocks

Unlock quizzes for free by uploading documents