The figure shows a standard normal N(0, 1) distribution. Find the z value for the shaded area. 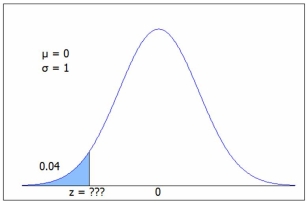 C.2 gives P(z < -1.75) = .0401 or use Excel =NORM.S.INV(0.04) = -1.75.
A) -1.98
B) -1.87
C) -1.75
D) -1.62
Correct Answer:
Verified
Q100: Compared to the area between z =
Q101: The figure shows a normal N(400, 23)
Q102: If the mean waiting time for the
Q103: The ages of job applicants for a
Q104: The triangular distribution T(10, 20, 50) has
Q106: The figure shows a standard normal N(0,
Q107: The figure shows a normal N(400, 23)
Q108: Could this function be a PDF?
Q109: The figure shows a standard normal N(0,
Q110: The figure shows a standard normal N(0,
Unlock this Answer For Free Now!
View this answer and more for free by performing one of the following actions

Scan the QR code to install the App and get 2 free unlocks

Unlock quizzes for free by uploading documents