The three diagrams below each show a supply curve for oil tankers over a relatively short period of time. 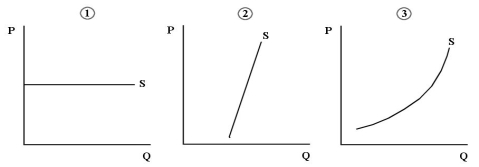 FIGURE 13-3
-Refer to Figure 13-3.Consider oil tankers as a factor of production (for example,for the production of gasoline) .Which diagram shows the most mobility of this factor of production?
A) diagram 1
B) diagram 2
C) diagram 3
D) none of the diagrams
E) each diagram shows mobility
Correct Answer:
Verified
Q95: Consider a manufacturing plant as an example
Q96: Which of the following statements about equilibrium
Q97: Factors of production (land,labour,and capital)tend to move
Q98: Suppose a cook at a diamond mining
Q99: The three diagrams below each show a
Q101: Consider the mobility of any factor of
Q102: If the supply curve for a factor
Q103: Suppose Harrison Ford makes 2 movies per
Q104: Choose the statement that best describes the
Q105: Which of the following concepts is most
Unlock this Answer For Free Now!
View this answer and more for free by performing one of the following actions

Scan the QR code to install the App and get 2 free unlocks

Unlock quizzes for free by uploading documents