The three diagrams below each show a supply curve for oil tankers over a relatively short period of time. 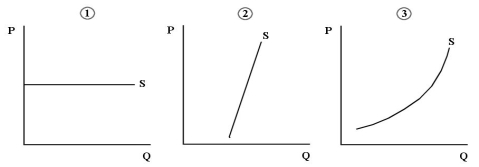 FIGURE 13-3
-Refer to Figure 13-3.Consider the supply of oil tankers to an individual Canadian shipping firm,the North American shipping industry,and the world shipping industry.Which diagram best shows the supply of oil tankers that is relevant to an individual Canadian firm?
A) diagram 1
B) diagram 2
C) diagram 3
D) diagrams 2 or 3
E) diagrams 1 or 2
Correct Answer:
Verified
Q88: The term "economic rent" refers to
A)a payment
Q89: The difference between temporary factor-price differentials and
Q90: Other things equal,if a particular province has
Q91: A temporary factor-price differential is one which
A)will
Q92: All of the following are examples of
Q94: According to the hypothesis of "equal net
Q95: Consider a manufacturing plant as an example
Q96: Which of the following statements about equilibrium
Q97: Factors of production (land,labour,and capital)tend to move
Q98: Suppose a cook at a diamond mining
Unlock this Answer For Free Now!
View this answer and more for free by performing one of the following actions

Scan the QR code to install the App and get 2 free unlocks

Unlock quizzes for free by uploading documents