The diagram below shows a set of budget lines facing a household. 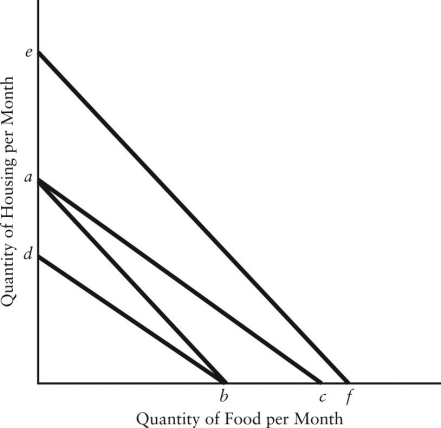 FIGURE 6-8
-Refer to Figure 6-8.The movement of the budget line from ab to ac could be caused by
A) an increase in money income.
B) an increase in the price of food.
C) an increase in the price of housing.
D) a decrease in the price of food.
E) a decrease in the price of housing.
Correct Answer:
Verified
Q109: An indifference curve plotted for two different
Q110: The diagram below shows a set of
Q111: Since there is a limited supply of
Q112: If money income is reduced by half,and
Q113: A parallel shift in the consumer's budget
Q115: The marginal rate of substitution
A)always has a
Q116: For your typical consumption levels of water
Q117: Suppose Arun consumes only 2 goods -
Q118: The table below shows the total value
Q119: Given a particular consumer's indifference map,the further
Unlock this Answer For Free Now!
View this answer and more for free by performing one of the following actions

Scan the QR code to install the App and get 2 free unlocks

Unlock quizzes for free by uploading documents