The table below shows hypothetical data for volumes of e-books and hardcover books sold over a 3-year period in a particular city.
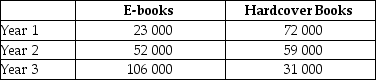 TABLE 2-3
-Refer to Table 2-3.Suppose we choose Year 1 as the base year and construct a series of index numbers with which to analyze the sales data.The index numbers for volumes of e-books sold (starting with Year 1) is
A) 100; 44.2; 21.7.
B) 100; 226.1; 460.9.
C) 23 000; 52 000; 106 000.
D) 100; 126.1; 360.1.
E) 1; 0.442; 0.217.
Correct Answer:
Verified
Q39: Suppose a theory predicts that lowering tuition
Q45: The table below shows hypothetical per-minute cell
Q47: The table below shows hypothetical per-minute cell
Q48: The table below shows hypothetical per-minute cell
Q50: An index number expresses the value of
Q51: As a science,economics is disadvantaged in that
A)it
Q51: When studying economic data,index numbers are especially
Q54: The table below shows hypothetical tuition costs
Q55: If a theory's prediction is tested and
Q55: The table below shows hypothetical per-minute cell
Unlock this Answer For Free Now!
View this answer and more for free by performing one of the following actions

Scan the QR code to install the App and get 2 free unlocks

Unlock quizzes for free by uploading documents