A company has the information shown in the chart below regarding its forecast performance in the past three periods. 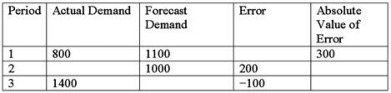 What is the mean absolute deviation (MAD) ?
A) 200
B) 225
C) -66.67
D) 1200
Correct Answer:
Verified
Q1: The demand for housing is characterized by
Q2: Suppose your firm is about to launch
Q5: Over a six-month period,the demand for a
Q7: Alpha Company sold 2,000 widgets yesterday.It had
Q10: Use the data below and the regression
Q11: An office manager forecasts demand for office
Q13: Zanda Corp.has experienced demand in the last
Q13: Strategic demand planning would best be utilized:
A)To
Q15: Refer to the data below for Zanda
Q20: Designing postponable products has the potential to
Unlock this Answer For Free Now!
View this answer and more for free by performing one of the following actions

Scan the QR code to install the App and get 2 free unlocks

Unlock quizzes for free by uploading documents