Multiple Choice
Exhibit 19.1 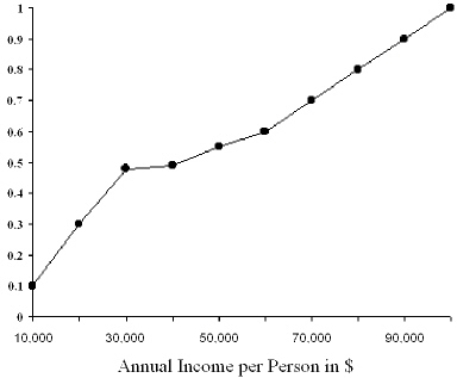 Refer to Exhibit 19.1.The figure above is an example of a
A) cumulative distribution function.
B) frequency polygon.
C) histogram.
D) one-way tabulation of annual income per person.
E) midpoint chart.
Correct Answer:
Verified
Related Questions

