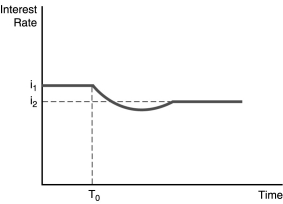
-The figure above illustrates the effect of an increased rate of money supply growth at time period T0.From the figure,one can conclude that the
A) liquidity effect is smaller than the expected inflation effect and interest rates adjust quickly to changes in expected inflation.
B) liquidity effect is larger than the expected inflation effect and interest rates adjust quickly to changes in expected inflation.
C) liquidity effect is larger than the expected inflation effect and interest rates adjust slowly to changes in expected inflation.
D) liquidity effect is smaller than the expected inflation effect and interest rates adjust slowly to changes in expected inflation.
Correct Answer:
Verified
Q103: When the price level falls,the _ curve
Q110: In the Keynesian liquidity preference framework,a rise
Q113: A business cycle expansion increases income,causing money
Q114: _ in the money supply creates excess
Unlock this Answer For Free Now!
View this answer and more for free by performing one of the following actions

Scan the QR code to install the App and get 2 free unlocks

Unlock quizzes for free by uploading documents