Figure 19-4.The figure shows a utility function for Dexter. 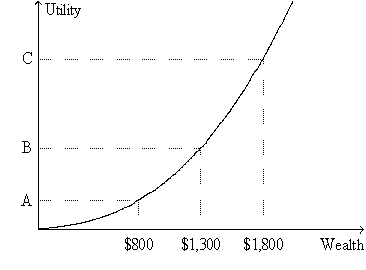
-Refer to Figure 19-4.From the appearance of the graph,we know that
A) Dexter's level of satisfaction increases by more when his wealth increases from $1,001 to $1,002 than it does when his wealth increases from $1,000 to $1,001.
B) Dexter's level of satisfaction increases by less when his wealth increases from $1,001 to $1,002 than it does when his wealth increases from $1,000 to $1,001.
C) Dexter's level of satisfaction increases by the same amount when his wealth increases from $1,001 to $1,002 as it does when his wealth increases from $1,000 to $1,001.
D) None of the above answers can be inferred from the appearance of the utility function.
Correct Answer:
Verified
Q33: A measure of the volatility of a
Q39: Diversification of a portfolio
A)can eliminate market risk,but
Q40: As the number of stocks in a
Q47: Which of the following games might a
Q52: Which of the following games might a
Q213: Figure 19-4.The figure shows a utility function
Q215: Figure 19-3.The figure shows a utility function
Q216: Figure 19-2.The figure shows a utility function
Q219: Figure 19-3.The figure shows a utility function
Q220: Figure 19-2.The figure shows a utility function
Unlock this Answer For Free Now!
View this answer and more for free by performing one of the following actions

Scan the QR code to install the App and get 2 free unlocks

Unlock quizzes for free by uploading documents