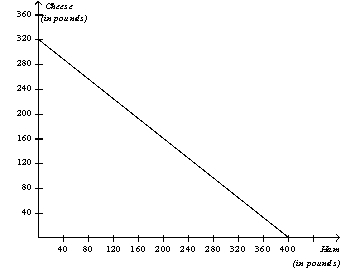
Figure 3-11
The graph below represents the various combinations of ham and cheese (in pounds) that the nation of Bonovia could produce in a given month.

-Refer to Figure 3-11.Whenever Bonovia increases its production of ham by 1 pound per month,then it must decrease its production of cheese by
A) 0.75 pound.
B) 0.80 pound.
C) 1.00 pounds.
D) 1.25 pounds.
Correct Answer:
Verified
Q15: Suppose that a worker in Boatland can
Q188: Trade between countries
A)allows each country to consume
Q334: Figure 3-10
Alice and Betty's Production Possibilities in
Q335: Table 3-12 Q336: Figure 3-11 Q337: Table 3-12 Q338: Figure 3-11 Unlock this Answer For Free Now! View this answer and more for free by performing one of the following actions Scan the QR code to install the App and get 2 free unlocks Unlock quizzes for free by uploading documents
![]()
The graph below represents the various
![]()
The graph below represents the various

