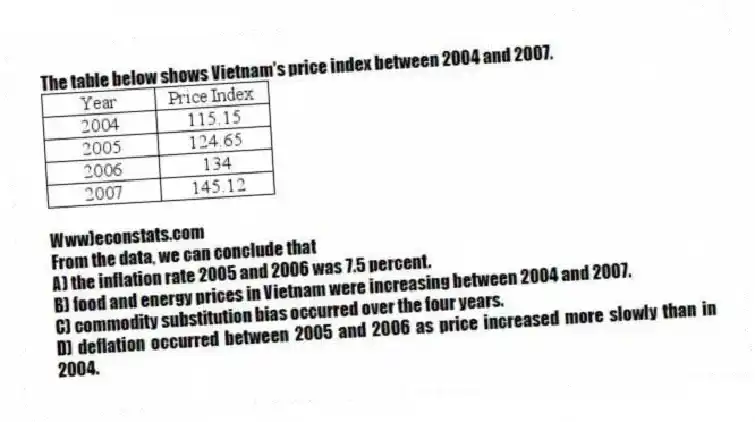
The table below shows Vietnam's price index between 2004 and 2007.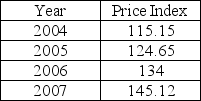
Www) econstats.com
From the data, we can conclude that
A) the inflation rate 2005 and 2006 was 7.5 percent.
B) food and energy prices in Vietnam were increasing between 2004 and 2007.
C) commodity substitution bias occurred over the four years.
D) deflation occurred between 2005 and 2006 as price increased more slowly than in 2004.
Correct Answer:
Verified
Q321: How does the Current Population Survey determine
Q323: The table below shows the price index
Q324: NPR ("Certain Green Industries Have Job Openings",
Q324: In late 2006, the unemployment rate increased
Q326: Why is unemployment a problem?
Q327: Reflecting the state of the economy in
Q327: In 2000, you could buy a Cadillac
Q329: ABC news in Australia reported that the
Q331: The table below shows the price index
Q339: How does the unemployment rate change in
Unlock this Answer For Free Now!
View this answer and more for free by performing one of the following actions

Scan the QR code to install the App and get 2 free unlocks

Unlock quizzes for free by uploading documents