The following diagram shows a market in equilibrium.If there was a $3.50 price floor, 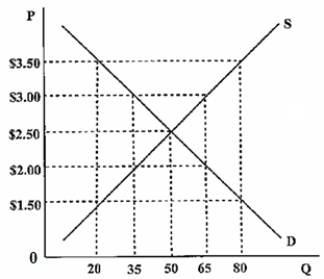
A) the quantity demanded would be 65 units.
B) the quantity demanded would be <
C) there would be a shortage of 60 units.
D) there would be a surplus of 60 units.
Correct Answer:
Verified
Q18: Draw supply and demand curves.Show the impact
Q19: Faith and Hope are 30-year-old identical twins.The
Q20: A working knowledge of both markets and
Q21: Which of the following is an example
Q22: Assume the government introduces a $0.50 per
Q24: The minimum wage
A)increases economic efficiency.
B)creates a shortage
Q25: There is an increase in incomes due
Q26: Let Qd = 10 - 2P and
Q27: Price controls on gasoline
A)increase consumer surplus.
B)create a
Q28: There is an OPEC cartel that reduces
Unlock this Answer For Free Now!
View this answer and more for free by performing one of the following actions

Scan the QR code to install the App and get 2 free unlocks

Unlock quizzes for free by uploading documents