The following diagram shows a market in equilibrium.If there was a $3.00 price floor, 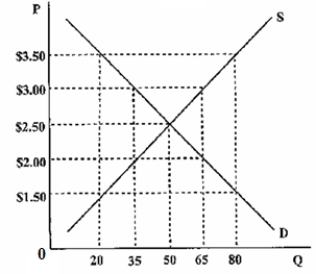
A) the quantity demanded would be 65 units.
B) the quantity demanded would be 30 units.
C) there would be a shortage of 30 units.
D) there would be a surplus of 30 units.
Correct Answer:
Verified
Q24: The minimum wage
A)increases economic efficiency.
B)creates a shortage
Q25: There is an increase in incomes due
Q26: Let Qd = 10 - 2P and
Q27: Price controls on gasoline
A)increase consumer surplus.
B)create a
Q28: There is an OPEC cartel that reduces
Q30: A price ceiling on a good will
Q31: The war in Iraq comes to an
Q32: There is an increase in availability of
Q33: Externalities exist when the actions of one
Q34: The minimum wage is a
A)cost ceiling.
B)positive externality.
C)price
Unlock this Answer For Free Now!
View this answer and more for free by performing one of the following actions

Scan the QR code to install the App and get 2 free unlocks

Unlock quizzes for free by uploading documents