A student was interested in the cigarette smoking habits of college students and collected data from an unbiased random sample of students. The data is summarized in the following table: 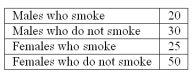 What type of chart best represents the frequency table?
A) Bar Chart
B) Pie Chart
C) Scatter plot
D) Frequency Polygon
Correct Answer:
Verified
Q26: A student was studying the political party
Q27: A student was studying the political party
Q29: A student was interested in the cigarette
Q30: What is the following table called?
Q32: The monthly salaries of a sample of
Q33: A student was studying the political party
Q34: A group of 100 students were surveyed
Q35: In a frequency distribution, the number of
Q36: A group of 100 students was surveyed
Q39: When a class interval is expressed as
Unlock this Answer For Free Now!
View this answer and more for free by performing one of the following actions

Scan the QR code to install the App and get 2 free unlocks

Unlock quizzes for free by uploading documents