A random sample of 40 companies with assets over $10 million was selected and asked for their annual computer technology expense and industry. The ANOVA comparing the average computer technology expense among three industries rejected the null hypothesis. The Mean Square Error (MSE) was 195. The following table summarized the results: 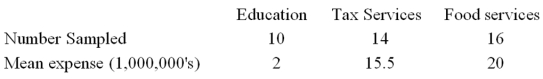 Based on the comparison between the mean annual computer technology expense for companies in the Education and Tax services industries,
A) A confidence interval shows that the mean annual computer technology expenses are not significantly different.
B) The ANOVA results show that the mean annual computer technology expenses are significantly different.
C) A confidence interval shows that the mean annual computer technology expenses are significantly different.
D) The ANOVA results show that the mean annual computer technology expenses are not significantly different.
Correct Answer:
Verified
Q27: Three different fertilizers were applied to a
Q36: A manufacturer of automobile transmissions uses two
Q37: In ANOVA analysis, when the null hypothesis
Q38: An electronics company wants to compare the
Q40: An experiment to determine the most effective
Q42: Two accounting professors decided to compare the
Q43: Given the following Analysis of Variance table
Q44: A random sample of 16 companies
Q45: Two accounting professors decided to compare the
Q46: A random sample of 30 executives from
Unlock this Answer For Free Now!
View this answer and more for free by performing one of the following actions

Scan the QR code to install the App and get 2 free unlocks

Unlock quizzes for free by uploading documents