A random sample of 30 executives from companies with assets over $1 million was selected and asked for their annual income and level of education. The ANOVA comparing the average income among three levels of education rejected the null hypothesis. The Mean Square Error (MSE) was 243.7. The following table summarized the results: 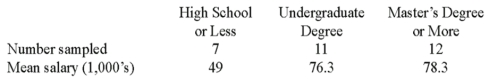 When comparing the mean annual incomes for executives with a High School education or less and Undergraduate Degree, the 95% confidence interval shows an interval of 11.7 to 42.7 for the difference. This result indicates that
A) There is no significant difference between the two incomes.
B) The interval contains a difference of zero.
C) Executives with an Undergraduate Degree earn significantly more than executives with a High School education or less.
D) Executives with an Undergraduate Degree earn significantly less than executives with a High School education or less.
Correct Answer:
Verified
Q51: A random sample of 40 companies
Q52: A random sample of 30 executives
Q53: Two accounting professors decided to compare the
Q54: Two accounting professors decided to compare the
Q55: Two accounting professors decided to compare the
Q57: Given the following Analysis of Variance table
Q58: Given the following Analysis of Variance table
Q59: Given the following Analysis of Variance table
Q60: Two accounting professors decided to compare the
Q61: The college of business was interested in
Unlock this Answer For Free Now!
View this answer and more for free by performing one of the following actions

Scan the QR code to install the App and get 2 free unlocks

Unlock quizzes for free by uploading documents