Refer to Figure 4.3.Which diagram most likely represents the indifference map for a good and a "bad"? 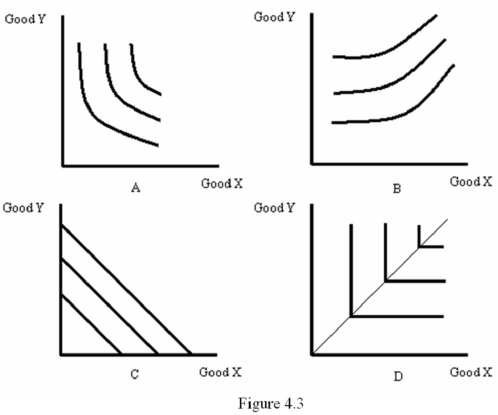
A) A
B) B
C) C
D) D
Correct Answer:
Verified
Q18: Refer to Table 4.1.Mike's preferences are consistent
Q19: Teresa consumes both steak and lobster.Suppose the
Q20: When comparing two alternatives X and Y,a
Q21: The marginal rate of substitution between two
Q22: A marginal rate of substitution formula tells
Q24: The rate at which a consumer will
Q25: Suppose Bart's MRS for sodas with chips
Q26: Suppose Addison is a big fan of
Q27: Higher rates of substitution are indicated by
Q28: Suppose a consumer's MRS is given by
Unlock this Answer For Free Now!
View this answer and more for free by performing one of the following actions

Scan the QR code to install the App and get 2 free unlocks

Unlock quizzes for free by uploading documents