Refer to Figure 5.6.Which diagram shows an increase in income with bread being inferior and soup being normal? 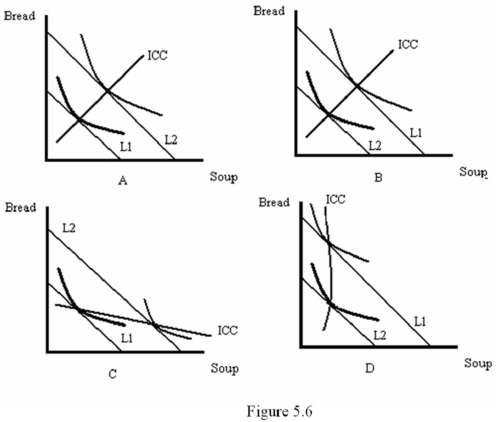
A) A
B) B
C) C
D) D
Correct Answer:
Verified
Q45: If two goods are substitutes,then an increase
Q46: Refer to Figure 5.6.Which diagram shows an
Q47: If a good is normal,then the Engel
Q48: When a good is normal:
A) an increase
Q49: Refer to Figure 5.7.Which diagram best represents
Q51: If the price of the good measured
Q52: If an increase in the price of
Q53: If the income-consumption path slopes upward,then:
A) both
Q54: Refer to Figure 5.7.Which diagram best represents
Q55: Which of the following statements is true?
A)
Unlock this Answer For Free Now!
View this answer and more for free by performing one of the following actions

Scan the QR code to install the App and get 2 free unlocks

Unlock quizzes for free by uploading documents