Refer to Figure 7.5.Which diagram represents isoquants for fixed-proportions technology? 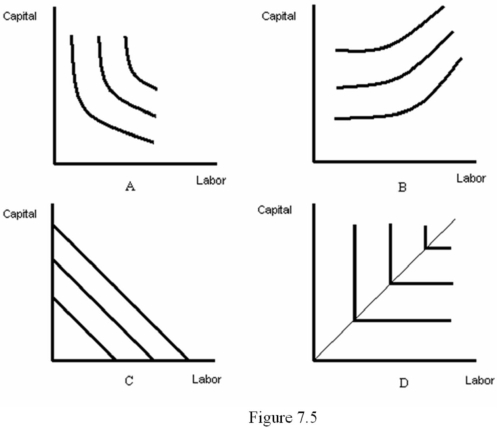
A) A
B) B
C) C
D) D
Correct Answer:
Verified
Q39: Refer to Figure 7.2.Which of the following
Q40: Refer to Figure 7.2.With which worker does
Q41: One reason that firms will experience decreasing
Q42: With _ returns to scale,production is most
Q43: Suppose a firm uses only capital and
Q45: Refer to Figure 7.6.Which graph represents decreasing
Q46: Refer to Figure 7.5.Which diagram represents isoquants
Q47: Returns to scale is a _ concept
Q48: For the Cobb-Douglas production function F(L,K)= ALαKβ,a
Q49: Refer to Figure 7.4.This isoquant exhibits:
Unlock this Answer For Free Now!
View this answer and more for free by performing one of the following actions

Scan the QR code to install the App and get 2 free unlocks

Unlock quizzes for free by uploading documents