Refer to Figure a.Assuming the solid line in the graph is a constant expected consumption line where Π (the probability of state S) = 0.50,which constant expected consumption line reflects an increase in Π? 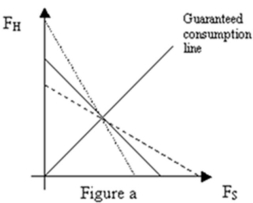
A) The dotted line
B) The dashed line
C) An increase in Π does not result in a change in the expected consumption line.
D) A change in Π results in a parallel shift in the expected consumption line, so neither the dotted nor the dashed line reflects this change.
Correct Answer:
Verified
Q2: Suppose Alice is deciding whether or not
Q3: Refer to Figures d and e.Water is
Q4: Suppose Brandon's indifference curves are defined as
Q5: Refer to Figure a.If Π (the probability
Q6: Suppose Lily's indifference curves are defined as
Q8: Suppose Brandon's indifference curves are defined as
Q9: Suppose Brandon's indifference curves are defined as
Q10: Risk:
A) is inherent in every action or
Q11: What is the standard deviation of the
Q12: A person is risk averse if:
A) his
Unlock this Answer For Free Now!
View this answer and more for free by performing one of the following actions

Scan the QR code to install the App and get 2 free unlocks

Unlock quizzes for free by uploading documents