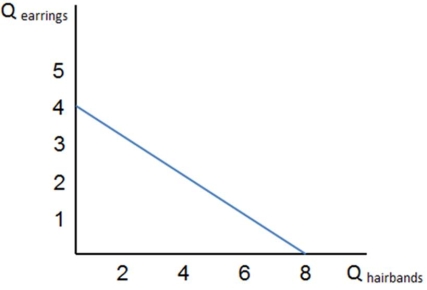
 The slope of the budget line in the graph shown:
A) represents the opportunity cost of the two goods relative to each other.
B) represents the relative marginal utilities from consuming the two goods.
C) measures the total utility the consumer gets from consuming the two goods.
D) is the consumer's income level.
Correct Answer:
Verified
Q51: Q52: A budget constraint is: Q53: This table shows the different combinations of Q54: When someone is served pizza and soda Q55: This table shows the different combinations of Q57: A budget constraint: Q58: You decide to forgo a third slice Q59: Dave and Buster play two games of Q60: This table shows the different combinations of Q61: ![]()
A) a line that
A) shows different bundles of![]()
Unlock this Answer For Free Now!
View this answer and more for free by performing one of the following actions

Scan the QR code to install the App and get 2 free unlocks

Unlock quizzes for free by uploading documents