Use the following to answer questions :
Figure 4-1 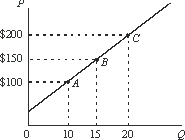
-The price elasticity of supply shown in Figure 4-1 between points A and B is:
A) .1.
B) .5.
C) 1.
D) 5.
E) none of the above.
Correct Answer:
Verified
Q10: If a demand curve displays unitary elasticity,
Q11: How do companies use price elasticity to
Q12: A vertical supply curve may be described
Q13: Rank the points A, B and C
Q14: The government has declared that they will
Q16: A change in the supply of a
Q17: If at a price of $10, quantity
Q18: Which of the following might explain why
Q19: How is it possible for a corn
Q20: Suppose that demand is everywhere price inelastic.In
Unlock this Answer For Free Now!
View this answer and more for free by performing one of the following actions

Scan the QR code to install the App and get 2 free unlocks

Unlock quizzes for free by uploading documents