The figure shows a graph of the power dissipated in a resistor as a function of the resistance.What quantity does the slope of this graph represent? 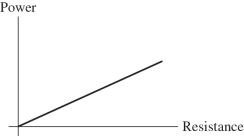
A) the current in the resistor
B) the potential difference across the resistor
C) the reciprocal of the current in the resistor
D) the square of the current in the resistor
E) the resistivity of the resistor
Correct Answer:
Verified
Q34: Which one of the following quantities is
Q35: The length of a certain wire is
Q36: The length of a certain wire is
Q37: Consider two copper wires of equal cross-sectional
Q38: Consider two copper wires of equal length.One
Q40: During a period of high power demand,the
Q41: A 5-µF,a 7-µF,and an unknown capacitor CX
Q42: Suppose you have two capacitors and want
Q43: You obtain a 100-W light bulb and
Q44: Four unequal resistors are connected in series
Unlock this Answer For Free Now!
View this answer and more for free by performing one of the following actions

Scan the QR code to install the App and get 2 free unlocks

Unlock quizzes for free by uploading documents