By analyzing the chart below,which of the following conclusion can be drawn?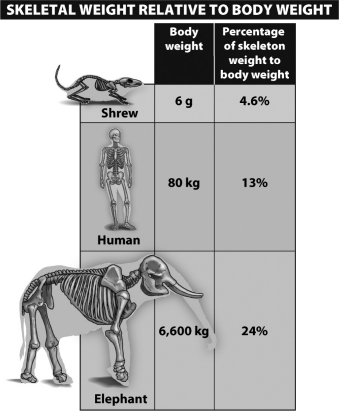
A) The skeletal portion of body weight increases with larger animals.
B) The skeletal portion of body weight decreases with larger animals.
C) The skeletal portion of body weight increases with smaller animals.
D) There is no correlation between the skeletal portion of body weight and animal size.
Correct Answer:
Verified
Q45: Ligaments are connective tissues that connect _
Q46: The blue whale reduces drag with its
Q47: Ostriches are huge nonflying birds that can
Q48: Lobsters,insects,and many other invertebrate groups have a(n)_,an
Q49: Weight training initially increases the strength of
Q51: One reason cats survive falls from heights
Q52: An increase in the width of an
Q53: Which of the following statements about support
Q54: Specialized bone cells,called _,are surrounded by calcium
Q55: A hydrostat stiffens when a muscle contracts
Unlock this Answer For Free Now!
View this answer and more for free by performing one of the following actions

Scan the QR code to install the App and get 2 free unlocks

Unlock quizzes for free by uploading documents