This table shows the different combinations of goods that Jack can consume,given that his income to spend on these two items is $10. 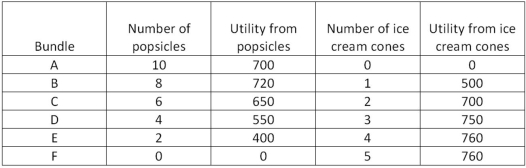
Considering the information in the table shown,the price of ice cream is:
A) $2 per cone.
B) $1 per cone.
C) decreases as Jack increases the amount consumed.
D) $5 per cone.
Correct Answer:
Verified
Q44: A budget constraint:
A) shows a constant dollar
Q45: A budget constraint:
A) is the same across
Q48: This table shows the different combinations of
Q49: This table shows the different combinations of
Q50: This table shows the different combinations of
Q51: This graph shows three different budget constraints:
Q52: Courtney goes for an hour bike ride
Q54: When someone is served pizza and soda
Q56: This graph shows three different budget constraints:
Q58: This graph shows three different budget constraints:
Unlock this Answer For Free Now!
View this answer and more for free by performing one of the following actions

Scan the QR code to install the App and get 2 free unlocks

Unlock quizzes for free by uploading documents