This graph shows the cost and revenue curves faced by a monopoly. 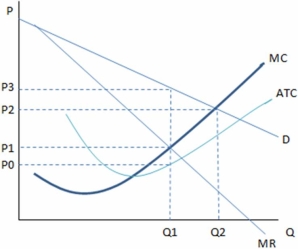
According to the graph shown,if Q1 units are being produced,this monopolist:
A) should increase production.
B) should charge P0 to maximize profits.
C) should charge P1 to maximize profits.
D) should charge P3 to maximize profits.
Correct Answer:
Verified
Q84: For markets operating at quantities lower than
Q85: This graph shows the cost and revenue
Q86: The public policies designed to mitigate the
Q87: The existence of a monopoly:
A)creates a gain
Q88: The monopolist chooses to produce:
A)where marginal cost
Q90: This graph shows the cost and revenue
Q91: One reason DeBeers has lost some of
Q92: This graph shows the cost and revenue
Q93: The existence of a monopoly:
A) creates market
Q94: This graph shows the cost and revenue
Unlock this Answer For Free Now!
View this answer and more for free by performing one of the following actions

Scan the QR code to install the App and get 2 free unlocks

Unlock quizzes for free by uploading documents