This graph shows the cost and revenue curves faced by a monopoly. 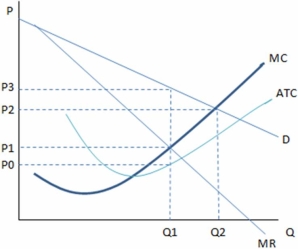
According to the graph shown,if Q2 units are being produced,this monopolist:
A) is not maximizing profits.
B) is producing where marginal costs are less than marginal revenue.
C) is earning negative profits.
D) should increase production.
Correct Answer:
Verified
Q68: For a monopoly, when marginal revenue is
Q75: The monopolist and the perfectly competitive firm
Q76: For a monopolist,at the profit-maximizing level of
Q77: The revenue curves the monopoly faces are
Q79: At any quantity of output above the
Q81: The equilibrium price and quantity in a
Q83: The presence of a monopoly helps:
A)producers.
B)consumers.
C)society overall.
D)All
Q84: For markets operating at quantities lower than
Q85: This graph shows the cost and revenue
Q86: The public policies designed to mitigate the
Unlock this Answer For Free Now!
View this answer and more for free by performing one of the following actions

Scan the QR code to install the App and get 2 free unlocks

Unlock quizzes for free by uploading documents