Table 12-4
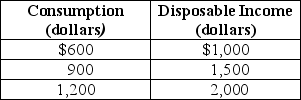
-Refer to Table 12-4.Given the data in the table above,the marginal propensity to consume is
A) 0.5.
B) 0.6.
C) 0.75.
D) 0.8.
Correct Answer:
Verified
Q132: Investment spending increases during _,and decreases during
Q133: _ is defined as national income +
Q134: The marginal propensity to consume is defined
Q135: If the marginal propensity to save is
Q136: If disposable income falls by $40 billion
Q138: During a(n)_ many firms experience reduced profits,which
Q139: If the MPC is 0.95,then a $10
Q140: If the marginal propensity to consume is
Q141: The difference between GDP and disposable income
Q142: Net exports usually _ when the U.S.economy
Unlock this Answer For Free Now!
View this answer and more for free by performing one of the following actions

Scan the QR code to install the App and get 2 free unlocks

Unlock quizzes for free by uploading documents